
AWS: PostgreSQL RDS "remaining connection slots are reserved" error
Today I had a problem with the PostgreSQL connection; both my application and the psql tool returned an error:
FATAL: remaining connection slots are reserved for non-replication superuser connections
The PostgreSQL server was running on the db.t1.micro RDS instance and the 'Current activity' column showed '22 connections', and the red line, which should represent the connection limit, was far away from the 22 value.
Here is how it looked:
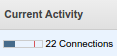
And this connection information is actually misleading - it shows 22 connections and it looks like only around 30% is consumed, while actually we are already at 100% of connections.
After some time, when the database load went down, I was able to log in
with psql to check the max_connections parameter:
template1=> show max_connections;
  max_connections
-----------------
 26
(1 row)
So we have 26 max connections and, as stated in comments (thanks, Johannes Schickling), there are also 3 connections reserved for the superuser.
That means we used 25 connections (22 + 3 reserved) out of 26.
The max_connections setting can also be found in the RDS UI, under
"Parameter Groups", but the value there is set as
{DBInstanceClassMemory/31457280}, so it is hard to be sure about
the actual value. The db.t1.micro instance has 1GB of memory, and a
calculation like 1024*1024*1024/31457280 gives around 34, while
actually it is 26.
The default value can be changed this way:
- create a new parameter group, using the default group as the parent
- edit the
max_connectionsvalue - once done, go to the DB instance settings (Modify action) and set the new parameter group.
But for me it seems to be a dangerous solution to use in production, because more connections will consume more memory and instead of connection limit errors, you can end up with out-of-memory errors.
So I decided to change the instance type to db.t2.small; it costs twice
as much, but it has 2GB of RAM and the default max_connections value is 60.
In my case, the higher connection consumption was not unexpected: Elastic Beanstalk scaled the application to 6 EC2 instances under load. Each instance runs a Flask application with several threads, so they can easily consume around 20 connections. To actually make sure that everything is OK with connection handling, run the following query:
template1=> select * from pg_stat_activity;

 datid |  datname | ... |    backend_start    | ... |     query_start     |    state_change     | waiting | state | ... |  query
-------+----------+-----+---------------------+-----+---------------------+---------------------+---------+-------+-----+--------------------------
 ...
 16395 | myapp    | ... | 2015-09-22 16:13:04 | ... | 2015-09-22 17:07:13 | 2015-09-22 17:07:13 | f       | idle  | ... | COMMIT
 16395 | myapp    | ... | 2015-09-22 16:14:13 | ... | 2015-09-22 17:07:21 | 2015-09-22 17:07:21 | f       | idle  | ... | ROLLBACK
 16395 | myapp    | ... | 2015-09-22 16:14:13 | ... | 2015-09-22 17:07:14 | 2015-09-22 17:07:14 | f       | idle  | ... | COMMIT
 16395 | myapp    | ... | 2015-09-22 16:14:13 | ... | 2015-09-22 17:07:18 | 2015-09-22 17:07:18 | f       | idle  | ... | ROLLBACK
 ...
(16 rows)
Here you can see all the connections, queries and last activity time for each connection, so it should be easy to see if there are any hanging connections.